How Do We Measure a Successful Graphic Design
Is creativity measurable? What Key Performance Indicator can managers use to track and improve the performance of a creative team?
- Creative process
- KPIs for graphical designer
- Example of KPIs in practice
Is it Possible to Measure Creativity?
A quick answer is "yes" – we can quantify and measure creativity. Let's take Salvador Dalí as an example. In his "Comparative table of the values after Dalinian analysis" created for the book "50 Secrets of Magic Craftsmanship," he scored the painters by such parameters as craftsmanship, inspiration, color, design, genius, composition, originality, mystery, and authenticity.
Measuring creativity is possible. Another question is how objective those measurements are and what is the purpose behind those measurements…
Measuring the Results of Creativity is Easier
As long as the purpose of measuring creativity and the objectiveness of such measurements is disputable, we can focus on something more tangible.
- We can measure the impact or the results of creativity.
We don't know who is a greater painter – Vermeer (one of the highest scores in Dalí's table) or Mondrian (one of the lowest scores), but we can count something tangible, such as the number of known paintings, sale price on auctions, or the number of mentions of certain painting in Google search results.
Mapping the Creative Process and Its Stakeholders
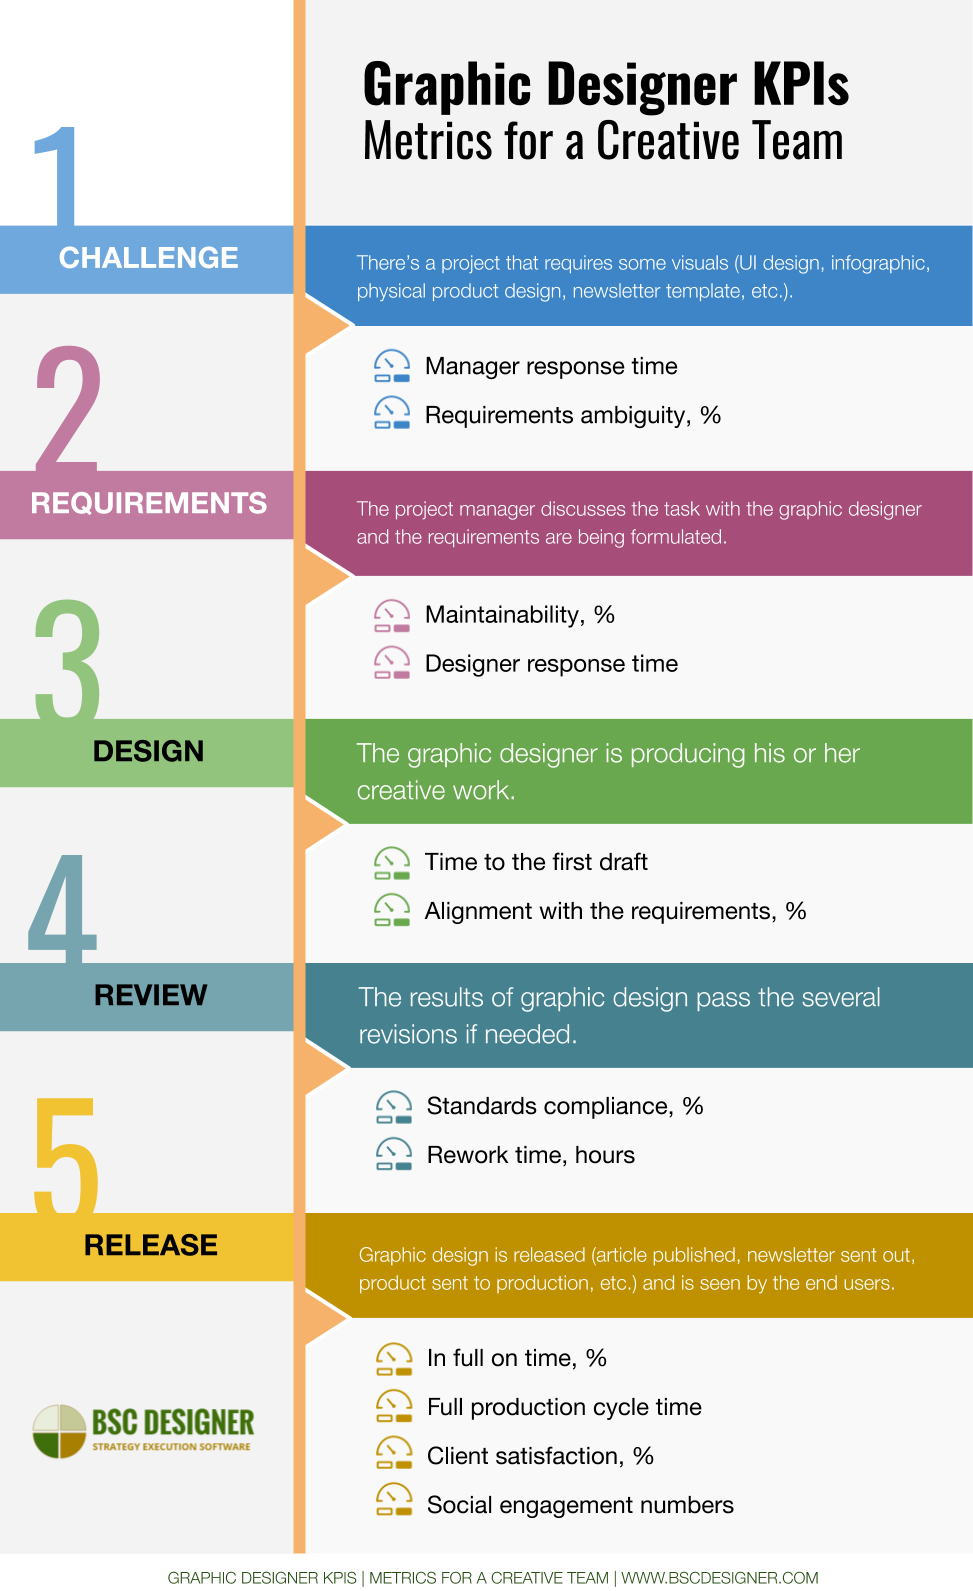
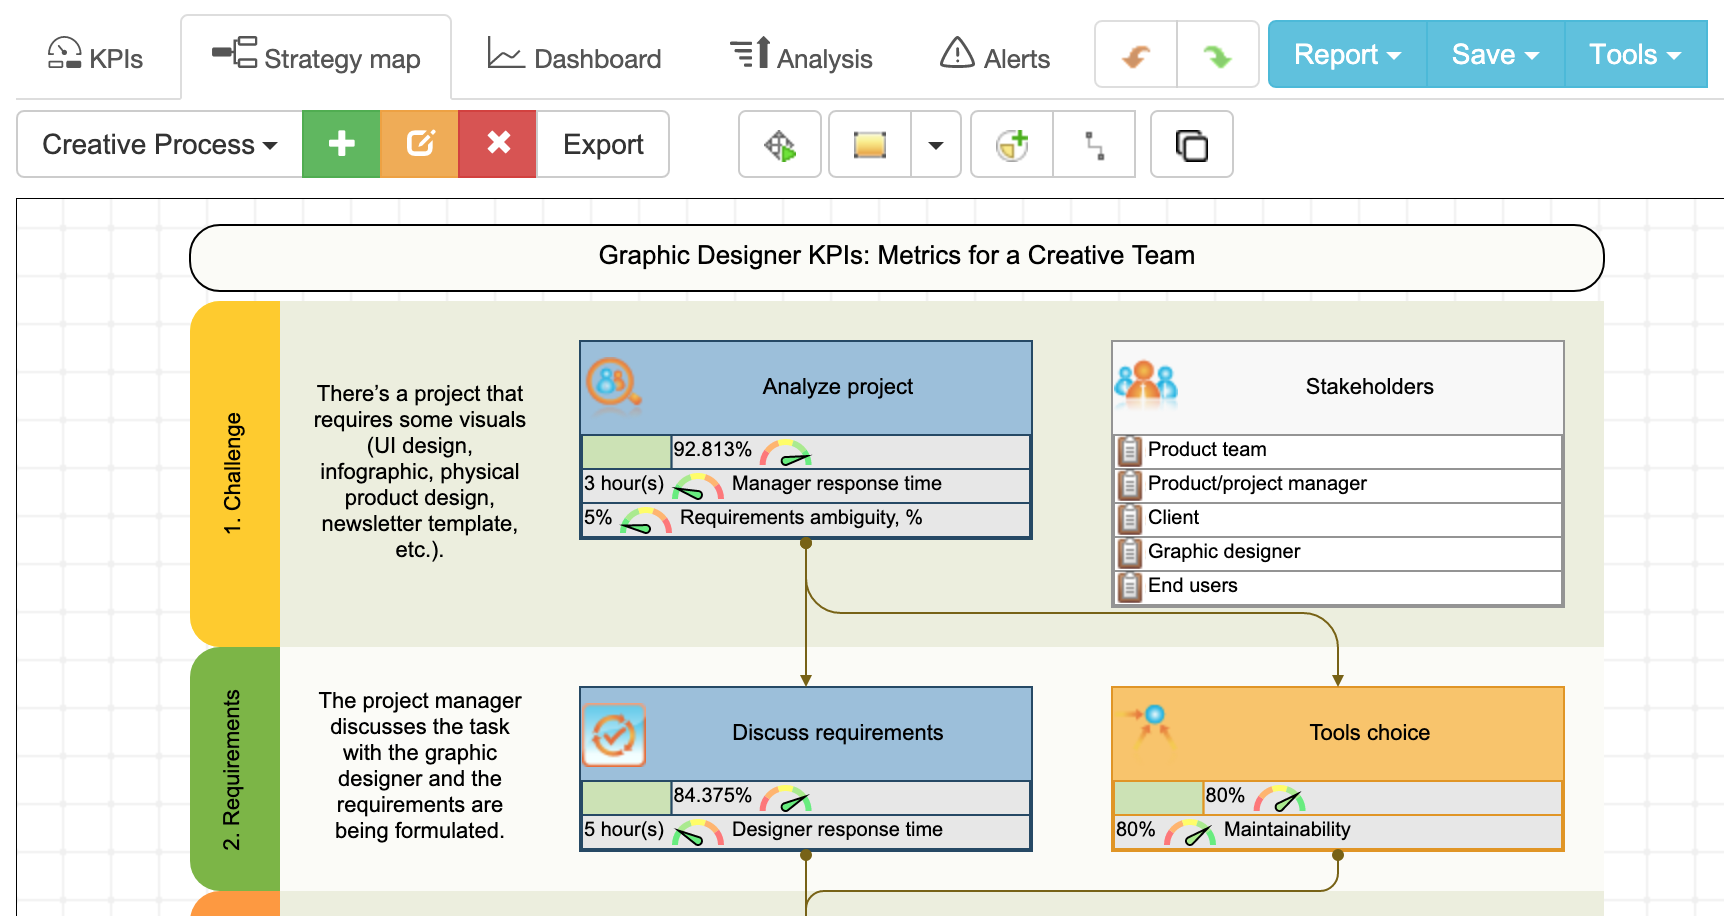
Let's get back to the business context. To approach the performance measurement challenge, I suggest starting with a quick look at a typical process of graphic design and the stakeholders involved:
- Challenge. There's a project that requires some visuals (UI design, infographic, physical product design, newsletter template, etc.).
- Requirements. The project manager discusses the task with the graphic designer and the requirements are being formulated.
- Design. The graphic designer is producing his or her creative work.
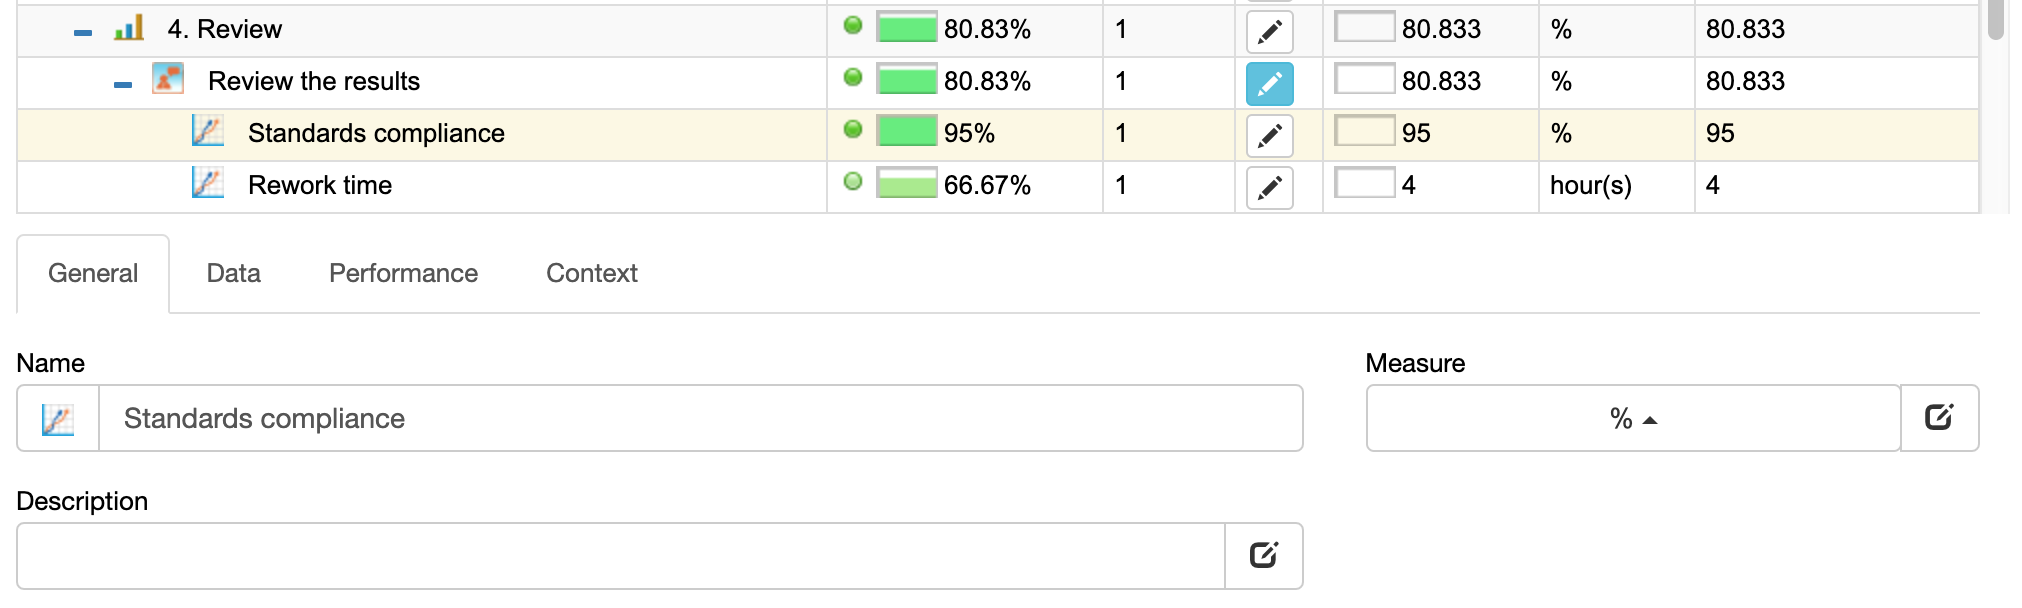
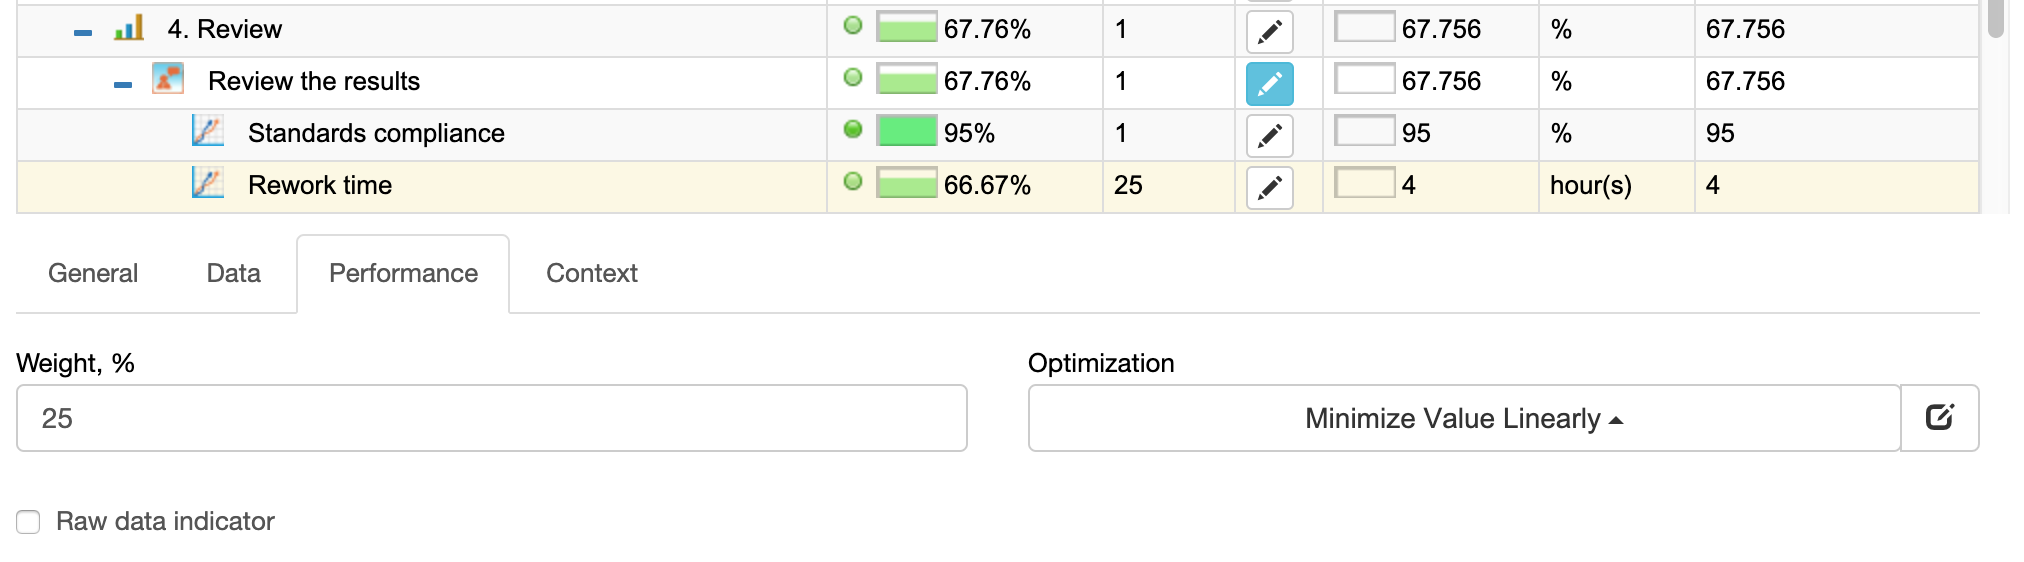
- Review. The results of graphic design pass the several revisions if needed.
- Release. Graphic design is released (article published, newsletter sent out, product sent to production, etc.) and is seen by the end users.
So far, we have a short list of the stakeholders:
- Product team
- Product/project manager
- Client (if you are creative agency)
- Graphic designer
- End users
Now, following the steps of the KPI system, we need to answer the "why?" question.
- Why do we want to measure the performance of the graphic designer?
- What are the goals of measurement?
Formulating Goals of Measurement
I'm looking at the design process discussed above, and I have some candidates in mind.
- Quality goal. Measure creativity to make sure that the quality of the graphic is a good one. To implement improvement ideas for the next designs.
- Impact goal. Measure creativity to make sure that the results don't just look nice and professional but help us achieve our business goals.
- Time and Money goal. Our time and financial budgets are limited, so we need to make sure that we move fast from discussion to the release at adequate cost.
Let's see how we can quantify and measure graphic designer efforts in the context of these goals.
KPIs for Graphic Designer
Here you have some KPIs for a graphic designer. Make sure to adjust them to the realities of your business before you start using them.
Quality KPIs
Before, we discussed quality in detail. What aspects of quality are important for the graphical design?
Standards Compliance, %
Let's start with a simple part – quality standards. We can have them for graphic design. These can be:
- Using file names in a specific format
- Delivering results in a certain resolution
- Delivering and achieving source files
- Using brand colors, fonts, styles
Following standards might be boring, but it is a good indicator of the internal discipline.
Maintainability, %
Maintainability indicates how easy it is to maintain something. How does it apply to graphic design?
In our case, maintainability was related to the choice of the tools. At BSC Designer, we localize articles to other languages. Have a look at these two articles– here you have an English version and here is a Spanish one. The texts on the illustrations are localized. In most cases, the illustrations are created in standard office software. This approach makes it easy to localize texts on the illustrations. Most graphical design will hate this approach, but in our case (focus on the content strategy), it's the preferred way to design illustrations as we can significantly reduce the costs of localization.
Rework time, hours
The design process that we discussed above implies some revisions. The goal of the manager is to know the benchmark for the "normal" rework time and the number of rework interactions.
Should this indicator go into the red zone, it's a signal that there is some communication problem, or the initial requirements were not well-defined.
Impact KPIs
Another direction to look at is the impact of what the graphic designer created. For example, if you have different ideas about the most engaging illustration for your content, you can do an a/b test.
In BSC Designer, we use our mail list to test some ideas. The idea is to divide the mail list into the segments and send emails with different versions of illustration to different segments.
Then we look at:
- Open rate, %
- Conversion rate, %
- Engagement metrics (time on site, bounce rate)
 Obviously, this approach should be adjusted according to the environment. The mentioned metrics can be used for article illustration. To test the design of business cards, the best idea is to simply use them in practice and see how people react to different designs (I've shared some examples in the event KPIs article).
The winning versions go to release and then after some time, we can track some more metrics:
- Client satisfaction (internal and external clients), %
- Social engagement numbers (e.g. likes and shares)
- Pinterest and Instagram shares for visual content
These metrics are influenced by many factors, but visually appealing graphic design is one of the most important success factors. In a separate article, we discussed more about the social media KPIs.
Time and Money Metrics
Look at the creative process described above. It looks like a production line. It might sound cynical, but graphic design is not just about creativity, it is also about well-organized processes.
How can we quantify this process? We will measure how effective communications are by tracking the time that it takes to move from one phase to another:
- Designer response time (time that designer needs to respond to the first request/follow up comments)
- Time to the first draft
- Manager response time (time that the manager needs to respond/approve)
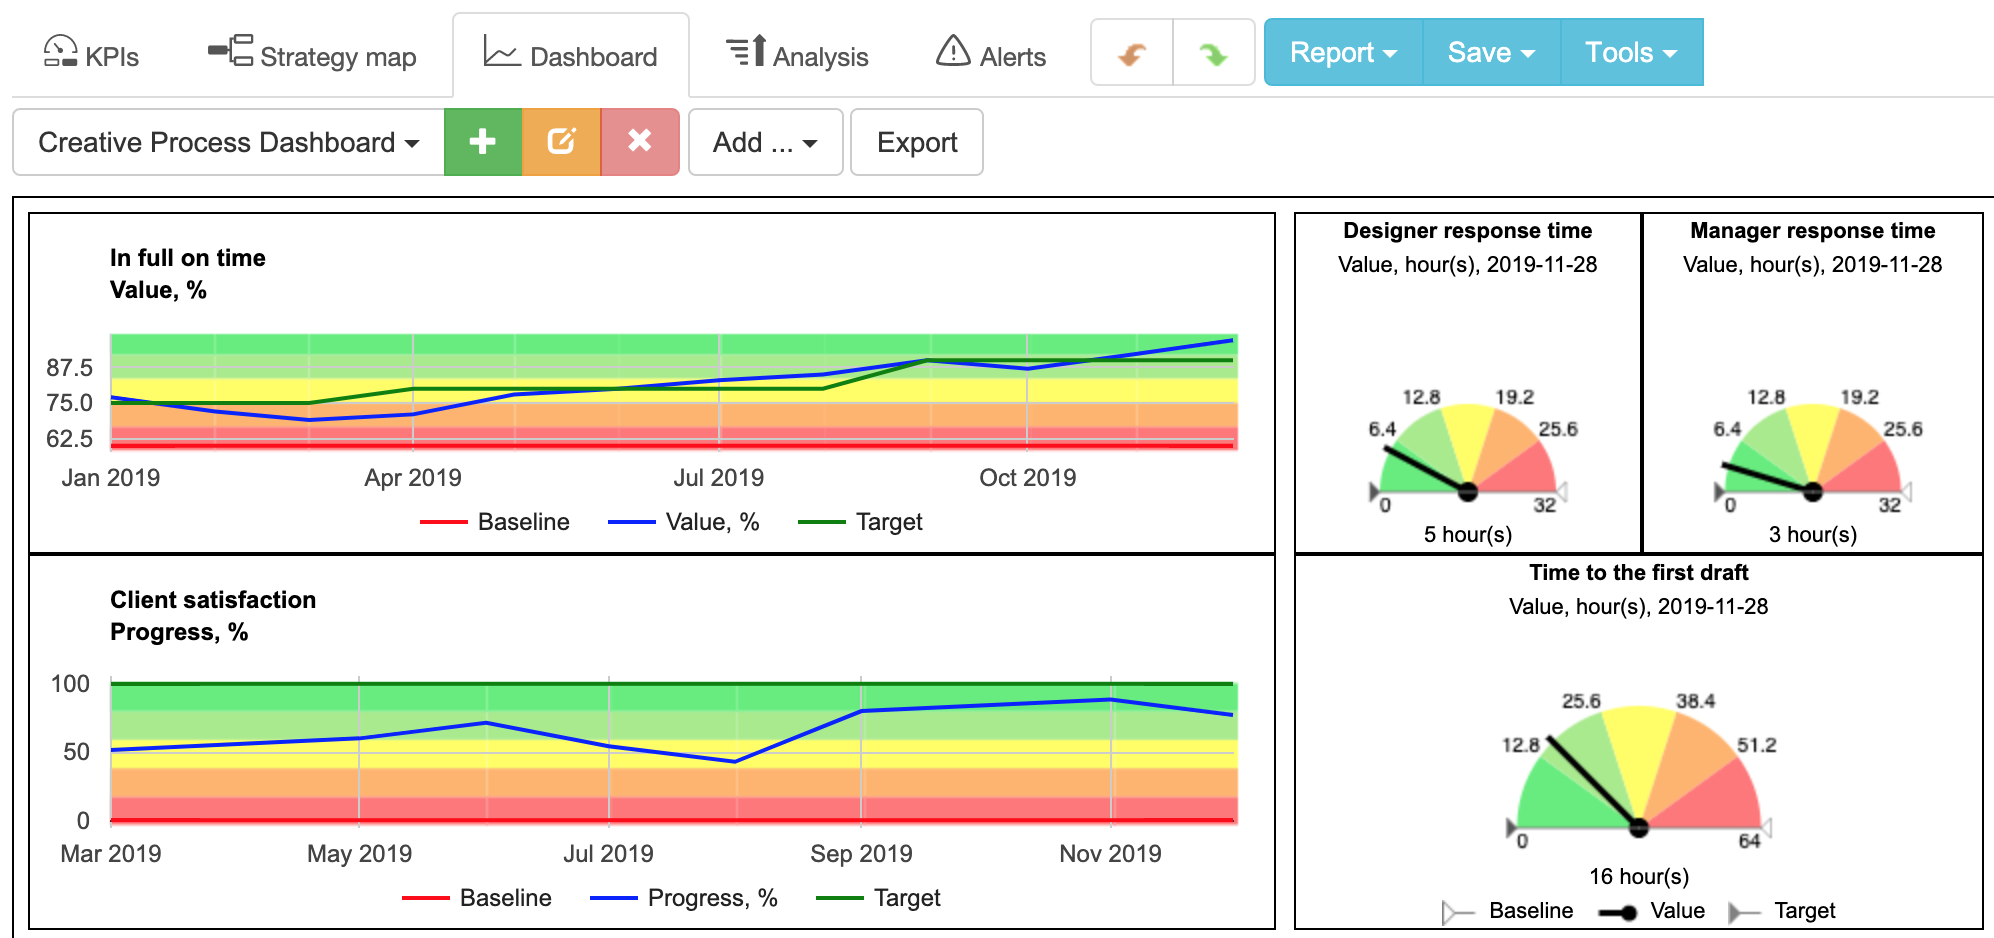
Respectively, we can have general metrics for the process:
- In full on time, %
- Production cycle time (time from request to delivery)
In a case of graphic design, time is a proxy of direct costs (the salary of designer). Giving your designer better tools and optimizing communication will result in the cost optimization.
We can also look at the traditional talent metrics that we have discussed before. Employee morale, engagement, turnover among top performers will affect any part of the business, including graphic design.
What Metrics We Use at BSC Designer
We have discussed different ways to quantify creative process. What are the most important KPIs that one should focus on? It depends on where your team is in terms of maturity and business organization. Here are some metrics that we focus on in BSC Designer.
Communications
In our case, (one of our values is "Support remote work, hire talents globally"). Having a remote team, we need to focus on effective communications.
- In our case, effective doesn't mean fast.
A 1-2 days response time might be perfectly fine. What is important is that:
- Out team has skills to unambiguously formulate design requirements, and
- Our design ideas are correctly understood by the designer.
In this sense, the rework time indicator is more important.
Support Content Marketing
Another theme in our marketing strategy is focus on high quality content. We are interested in adding engaging illustrations to all articles we publish. We indirectly validate the quality of illustrations by the social metrics and make sure that the graphic content is maintainable and is easy to update and localize to other languages.
It's Your Turn
As a manager, what indicators are you looking at? As a graphic designer, how could managers help you to do a better job?
Personalized Setup
Need help to configure the Graphic Designer KPIs for your organization?
 What's next?
- Access templates. Sign-up with a free plan at BSC Designer for immediate access to 30 scorecard templates, including Graphic Designer KPIs discussed in this article.
- Master skills. Check out free video tutorial for the Balanced Scorecard. Master your strategy planning and execution skills with Strategy Execution training.
- Automate. Learn what Balanced Scorecard software is and how it can make your life easier by automating strategy execution, KPIs, and strategy maps.

Strategy Map Wizard – Balanced Scorecard in 6 Minutes
Answer simple questions - build a professional strategy map in 6 minutes.
Strategy formulation and description might be a time-consuming project even for an experienced strategist. This Strategy Scorecard Wizard will make the whole process fast and intuitive.
More Examples of the Balanced Scorecard

How Do We Measure a Successful Graphic Design
Source: https://bscdesigner.com/graphic-designer-kpis.htm
0 Response to "How Do We Measure a Successful Graphic Design"
Post a Comment